Search Results
Posts tagged "data visualization"
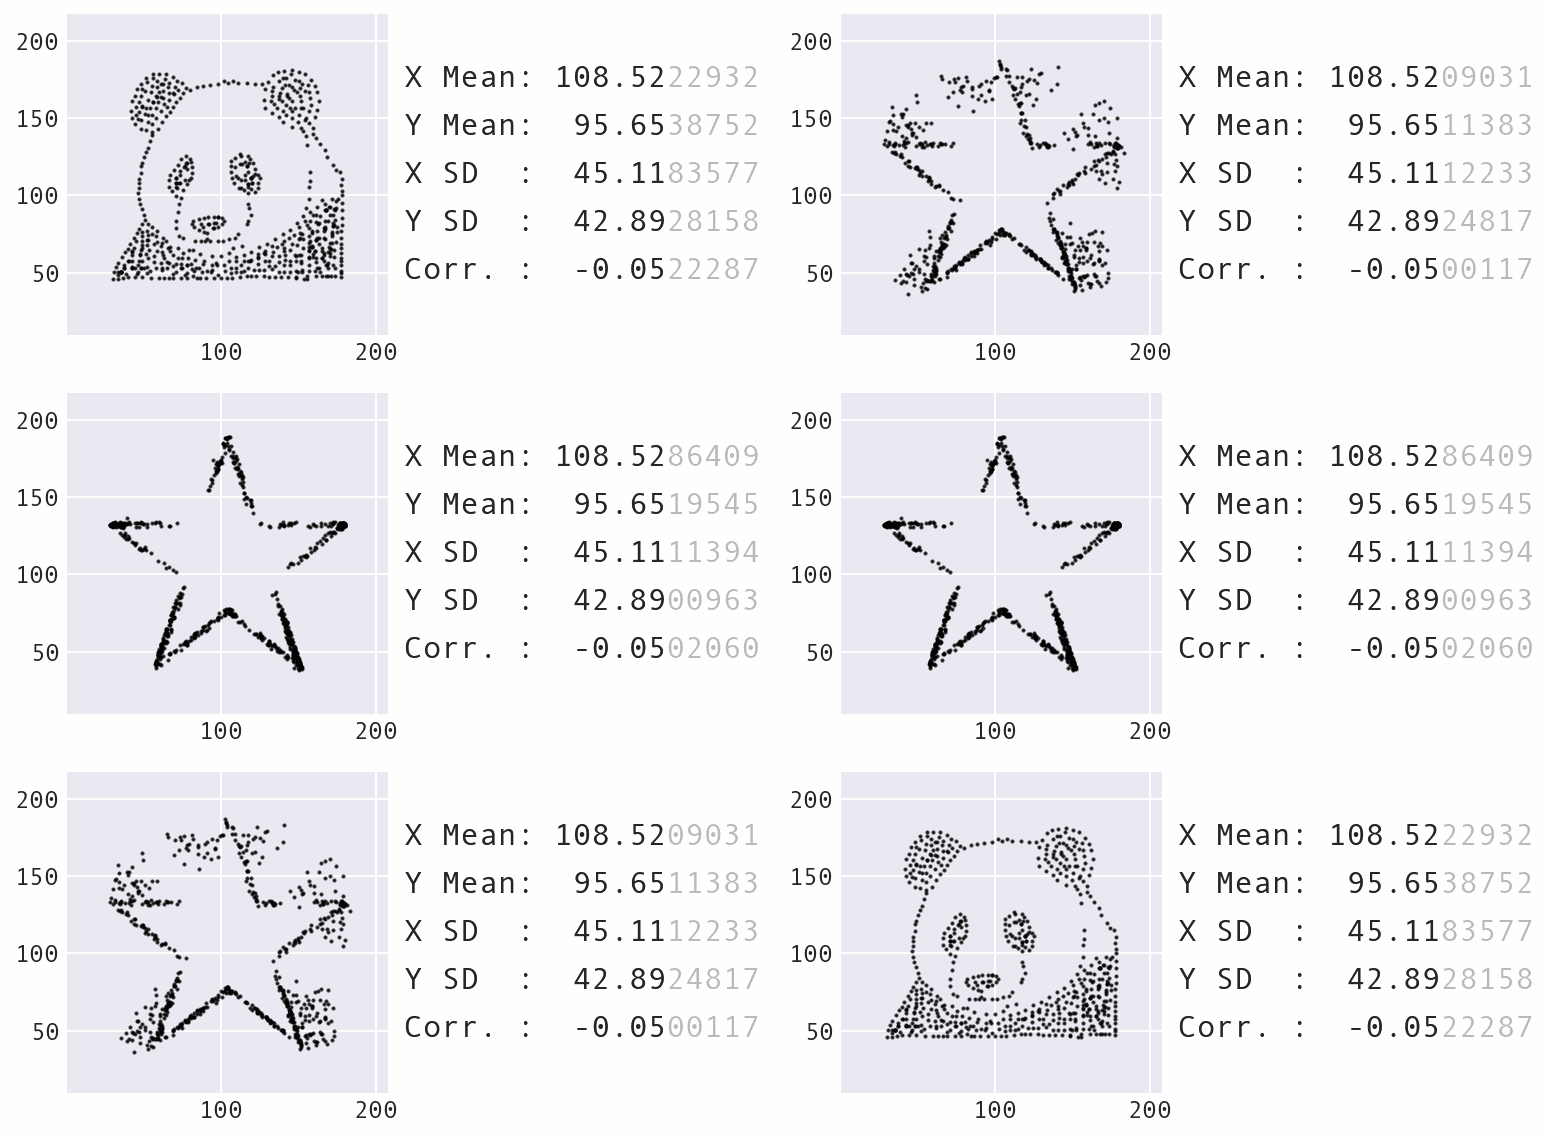
click here for the tag listingThis article introduces Data Morph, a new open source Python package that can be used to morph an input dataset of 2D points into select shapes, while preserving the summary statistics to a given number of decimal points through simulated annealing.
data science,
Python,
open source software,
data visualization,
projects
How to Pivot and Plot Data with Pandas
5 min read

