diagnostics#
Diagnostic plot to visualize a shape superimposed on the dataset.
Functions
|
Plot a shape superimposed on a dataset to evaluate heuristics. |
- data_morph.plotting.diagnostics.plot_shape_on_dataset(dataset: Dataset, shape: Shape, show_bounds: bool = False, alpha: Number = 0.25) Axes[source]#
Plot a shape superimposed on a dataset to evaluate heuristics.
- Parameters:
- Returns:
The
Axesobject containing the plot.- Return type:
Examples
from data_morph.data.loader import DataLoader
from data_morph.plotting.diagnostics import plot_shape_on_dataset
from data_morph.shapes.lines import Star

dataset = DataLoader.load_dataset('music')
shape = Star(dataset)
plot_shape_on_dataset(dataset, shape, show_bounds=True, alpha=0.1)
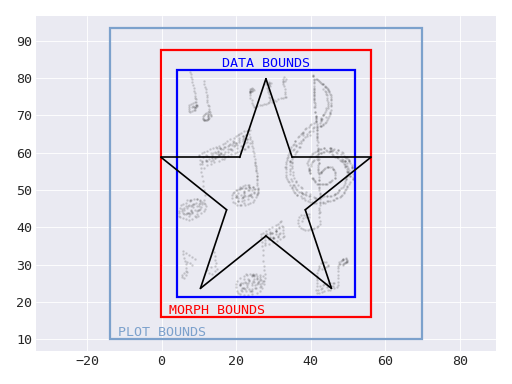
Visualization of the
Starshape when calculated based on the musicDataset, with the dataset’s bounds.#from data_morph.data.loader import DataLoader from data_morph.plotting.diagnostics import plot_shape_on_dataset from data_morph.shapes.points import Heart dataset = DataLoader.load_dataset('music') shape = Heart(dataset) plot_shape_on_dataset(dataset, shape, alpha=0.1)
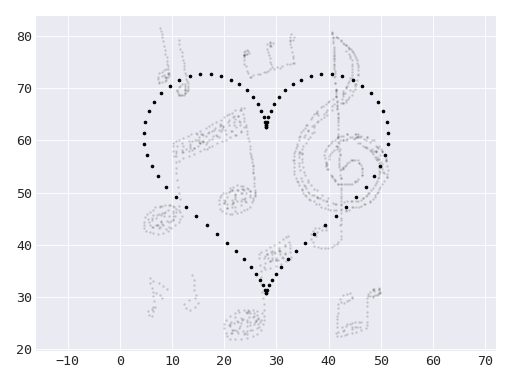
Visualization of the
Heartshape when calculated based on the musicDataset, without the dataset’s bounds.#