Dataset#
- class data_morph.data.dataset.Dataset(name: str, data: pd.DataFrame, scale: Number | None = None)[source]#
Bases:
objectClass for representing a starting dataset and bounds.
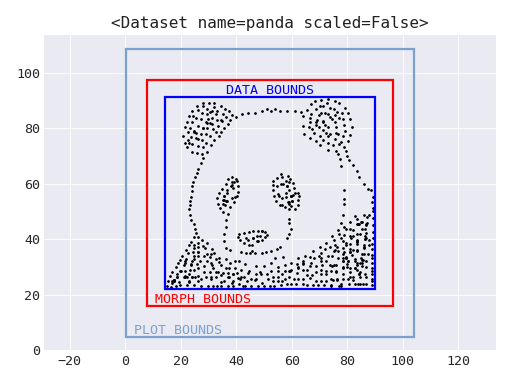
Upon creation, these bounds are automatically calculated. Use
plot()to generate this visualization.#- Parameters:
name (str) – The name to use for the dataset.
data (pandas.DataFrame) – DataFrame containing columns x and y.
scale (numbers.Number, optional) – The factor to scale the data by (can be used to speed up morphing). Values in the data’s x and y columns will be divided by this value.
See also
DataLoaderUtility for creating
Datasetobjects from CSV files.
- data: pd.DataFrame#
DataFrame containing columns x and y.
- data_bounds: BoundingBox#
The bounds of the data.
- marginals: tuple[tuple[np.ndarray, np.ndarray], tuple[np.ndarray, np.ndarray]]#
The counts per bin and bin boundaries for generating marginal plots.
- morph_bounds: BoundingBox#
The limits for the morphing process.
- plot(ax: Axes | None = None, show_bounds: bool = True, title: str | None = 'default', alpha: Number = 1) Axes[source]#
Plot the dataset and its bounds.
- Parameters:
ax (matplotlib.axes.Axes, optional) – An optional
Axesobject to plot on.show_bounds (bool, default
True) – Whether to plot the bounds of the dataset.title (str |
None, optional) – Title to use for the plot. The default will callstr()on the Dataset. PassNoneto leave the plot untitled.alpha (Number, default
1) – The transparency to use for the points in the plot.
- Returns:
The
Axesobject containing the plot.- Return type:
- plot_bounds: BoundingBox#
The bounds to use when plotting the morphed data.