lines#
Shapes made up of lines.
- class data_morph.shapes.lines.Diamond(dataset: Dataset)[source]#
Bases:
LineCollectionClass for the diamond shape.
This shape is generated using the panda dataset.#
- Parameters:
dataset (Dataset) – The starting dataset to morph into other shapes.
- distance(x: Number, y: Number) float#
Calculate the minimum distance from the lines of this shape to a point (x, y).
- Parameters:
x (numbers.Number) – Coordinates of a point in 2D space.
y (numbers.Number) – Coordinates of a point in 2D space.
- Returns:
The minimum distance from the lines of this shape to the point (x, y).
- Return type:
Notes
Implementation based on this Stack Overflow answer.
- lines#
An iterable of two (x, y) pairs representing the endpoints of a line.
- Type:
Iterable[Iterable[numbers.Number]]
- name: str | None = None#
The display name for the shape, if the lowercased class name is not desired.
- plot(ax: Axes | None = None) Axes#
Plot the shape.
- Parameters:
ax (matplotlib.axes.Axes, optional) – An optional
Axesobject to plot on.- Returns:
The
Axesobject containing the plot.- Return type:
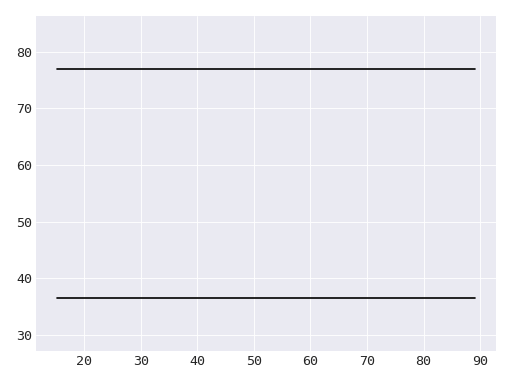
- class data_morph.shapes.lines.HighLines(dataset: Dataset)[source]#
Bases:
LineCollectionClass for the high lines shape.
This shape is generated using the panda dataset.#
- Parameters:
dataset (Dataset) – The starting dataset to morph into other shapes.
- distance(x: Number, y: Number) float#
Calculate the minimum distance from the lines of this shape to a point (x, y).
- Parameters:
x (numbers.Number) – Coordinates of a point in 2D space.
y (numbers.Number) – Coordinates of a point in 2D space.
- Returns:
The minimum distance from the lines of this shape to the point (x, y).
- Return type:
Notes
Implementation based on this Stack Overflow answer.
- lines#
An iterable of two (x, y) pairs representing the endpoints of a line.
- Type:
Iterable[Iterable[numbers.Number]]
- name: str | None = 'high_lines'#
The display name for the shape, if the lowercased class name is not desired.
- plot(ax: Axes | None = None) Axes#
Plot the shape.
- Parameters:
ax (matplotlib.axes.Axes, optional) – An optional
Axesobject to plot on.- Returns:
The
Axesobject containing the plot.- Return type:
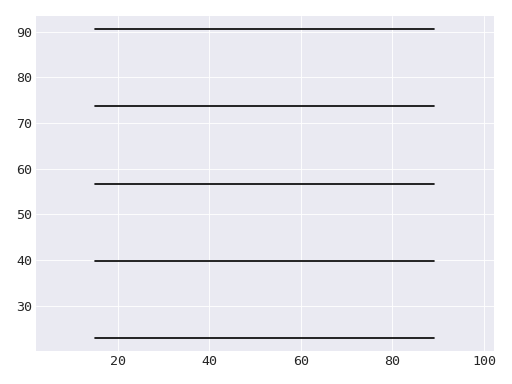
- class data_morph.shapes.lines.HorizontalLines(dataset: Dataset)[source]#
Bases:
LineCollectionClass for the horizontal lines shape.
This shape is generated using the panda dataset.#
- Parameters:
dataset (Dataset) – The starting dataset to morph into other shapes.
- distance(x: Number, y: Number) float#
Calculate the minimum distance from the lines of this shape to a point (x, y).
- Parameters:
x (numbers.Number) – Coordinates of a point in 2D space.
y (numbers.Number) – Coordinates of a point in 2D space.
- Returns:
The minimum distance from the lines of this shape to the point (x, y).
- Return type:
Notes
Implementation based on this Stack Overflow answer.
- lines#
An iterable of two (x, y) pairs representing the endpoints of a line.
- Type:
Iterable[Iterable[numbers.Number]]
- name: str | None = 'h_lines'#
The display name for the shape, if the lowercased class name is not desired.
- plot(ax: Axes | None = None) Axes#
Plot the shape.
- Parameters:
ax (matplotlib.axes.Axes, optional) – An optional
Axesobject to plot on.- Returns:
The
Axesobject containing the plot.- Return type:
- class data_morph.shapes.lines.Rectangle(dataset: Dataset)[source]#
Bases:
LineCollectionClass for the rectangle shape.
This shape is generated using the panda dataset.#
- Parameters:
dataset (Dataset) – The starting dataset to morph into other shapes.
- distance(x: Number, y: Number) float#
Calculate the minimum distance from the lines of this shape to a point (x, y).
- Parameters:
x (numbers.Number) – Coordinates of a point in 2D space.
y (numbers.Number) – Coordinates of a point in 2D space.
- Returns:
The minimum distance from the lines of this shape to the point (x, y).
- Return type:
Notes
Implementation based on this Stack Overflow answer.
- lines#
An iterable of two (x, y) pairs representing the endpoints of a line.
- Type:
Iterable[Iterable[numbers.Number]]
- name: str | None = None#
The display name for the shape, if the lowercased class name is not desired.
- plot(ax: Axes | None = None) Axes#
Plot the shape.
- Parameters:
ax (matplotlib.axes.Axes, optional) – An optional
Axesobject to plot on.- Returns:
The
Axesobject containing the plot.- Return type:
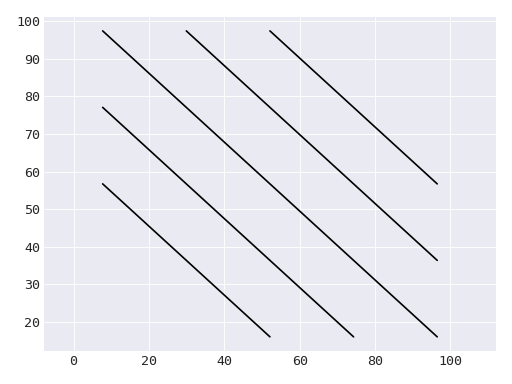
- class data_morph.shapes.lines.SlantDownLines(dataset: Dataset)[source]#
Bases:
LineCollectionClass for the slant down lines shape.

This shape is generated using the panda dataset.#
- Parameters:
dataset (Dataset) – The starting dataset to morph into other shapes.
- distance(x: Number, y: Number) float#
Calculate the minimum distance from the lines of this shape to a point (x, y).
- Parameters:
x (numbers.Number) – Coordinates of a point in 2D space.
y (numbers.Number) – Coordinates of a point in 2D space.
- Returns:
The minimum distance from the lines of this shape to the point (x, y).
- Return type:
Notes
Implementation based on this Stack Overflow answer.
- lines#
An iterable of two (x, y) pairs representing the endpoints of a line.
- Type:
Iterable[Iterable[numbers.Number]]
- name: str | None = 'slant_down'#
The display name for the shape, if the lowercased class name is not desired.
- plot(ax: Axes | None = None) Axes#
Plot the shape.
- Parameters:
ax (matplotlib.axes.Axes, optional) – An optional
Axesobject to plot on.- Returns:
The
Axesobject containing the plot.- Return type:
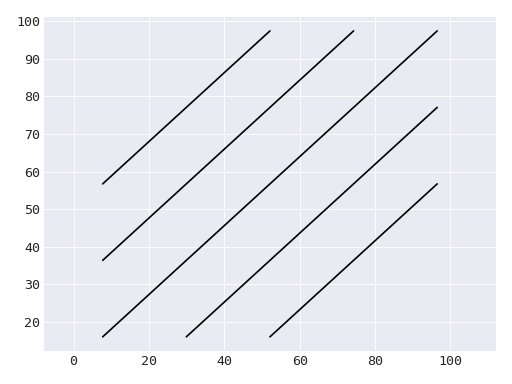
- class data_morph.shapes.lines.SlantUpLines(dataset: Dataset)[source]#
Bases:
LineCollectionClass for the slant up lines shape.
This shape is generated using the panda dataset.#
- Parameters:
dataset (Dataset) – The starting dataset to morph into other shapes.
- distance(x: Number, y: Number) float#
Calculate the minimum distance from the lines of this shape to a point (x, y).
- Parameters:
x (numbers.Number) – Coordinates of a point in 2D space.
y (numbers.Number) – Coordinates of a point in 2D space.
- Returns:
The minimum distance from the lines of this shape to the point (x, y).
- Return type:
Notes
Implementation based on this Stack Overflow answer.
- lines#
An iterable of two (x, y) pairs representing the endpoints of a line.
- Type:
Iterable[Iterable[numbers.Number]]
- name: str | None = 'slant_up'#
The display name for the shape, if the lowercased class name is not desired.
- plot(ax: Axes | None = None) Axes#
Plot the shape.
- Parameters:
ax (matplotlib.axes.Axes, optional) – An optional
Axesobject to plot on.- Returns:
The
Axesobject containing the plot.- Return type:
- class data_morph.shapes.lines.Star(dataset: Dataset)[source]#
Bases:
LineCollectionClass for the star shape.
This shape is generated using the panda dataset.#
- Parameters:
dataset (Dataset) – The starting dataset to morph into other shapes.
- distance(x: Number, y: Number) float#
Calculate the minimum distance from the lines of this shape to a point (x, y).
- Parameters:
x (numbers.Number) – Coordinates of a point in 2D space.
y (numbers.Number) – Coordinates of a point in 2D space.
- Returns:
The minimum distance from the lines of this shape to the point (x, y).
- Return type:
Notes
Implementation based on this Stack Overflow answer.
- lines#
An iterable of two (x, y) pairs representing the endpoints of a line.
- Type:
Iterable[Iterable[numbers.Number]]
- name: str | None = None#
The display name for the shape, if the lowercased class name is not desired.
- plot(ax: Axes | None = None) Axes#
Plot the shape.
- Parameters:
ax (matplotlib.axes.Axes, optional) – An optional
Axesobject to plot on.- Returns:
The
Axesobject containing the plot.- Return type:
- class data_morph.shapes.lines.VerticalLines(dataset: Dataset)[source]#
Bases:
LineCollectionClass for the vertical lines shape.
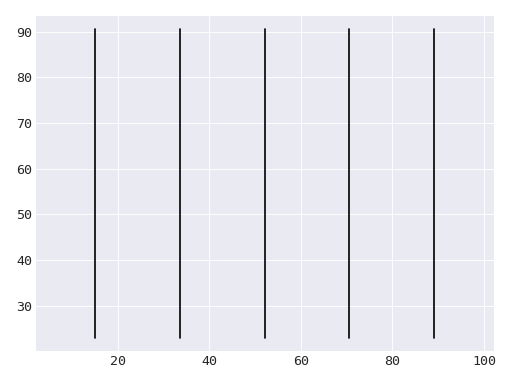
This shape is generated using the panda dataset.#
- Parameters:
dataset (Dataset) – The starting dataset to morph into other shapes.
- distance(x: Number, y: Number) float#
Calculate the minimum distance from the lines of this shape to a point (x, y).
- Parameters:
x (numbers.Number) – Coordinates of a point in 2D space.
y (numbers.Number) – Coordinates of a point in 2D space.
- Returns:
The minimum distance from the lines of this shape to the point (x, y).
- Return type:
Notes
Implementation based on this Stack Overflow answer.
- lines#
An iterable of two (x, y) pairs representing the endpoints of a line.
- Type:
Iterable[Iterable[numbers.Number]]
- name: str | None = 'v_lines'#
The display name for the shape, if the lowercased class name is not desired.
- plot(ax: Axes | None = None) Axes#
Plot the shape.
- Parameters:
ax (matplotlib.axes.Axes, optional) – An optional
Axesobject to plot on.- Returns:
The
Axesobject containing the plot.- Return type:
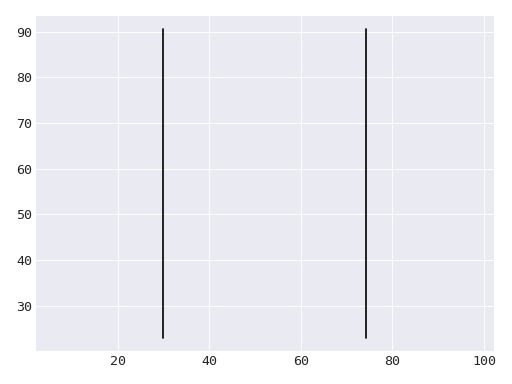
- class data_morph.shapes.lines.WideLines(dataset: Dataset)[source]#
Bases:
LineCollectionClass for the wide lines shape.

This shape is generated using the panda dataset.#
- Parameters:
dataset (Dataset) – The starting dataset to morph into other shapes.
- distance(x: Number, y: Number) float#
Calculate the minimum distance from the lines of this shape to a point (x, y).
- Parameters:
x (numbers.Number) – Coordinates of a point in 2D space.
y (numbers.Number) – Coordinates of a point in 2D space.
- Returns:
The minimum distance from the lines of this shape to the point (x, y).
- Return type:
Notes
Implementation based on this Stack Overflow answer.
- lines#
An iterable of two (x, y) pairs representing the endpoints of a line.
- Type:
Iterable[Iterable[numbers.Number]]
- name: str | None = 'wide_lines'#
The display name for the shape, if the lowercased class name is not desired.
- plot(ax: Axes | None = None) Axes#
Plot the shape.
- Parameters:
ax (matplotlib.axes.Axes, optional) – An optional
Axesobject to plot on.- Returns:
The
Axesobject containing the plot.- Return type:
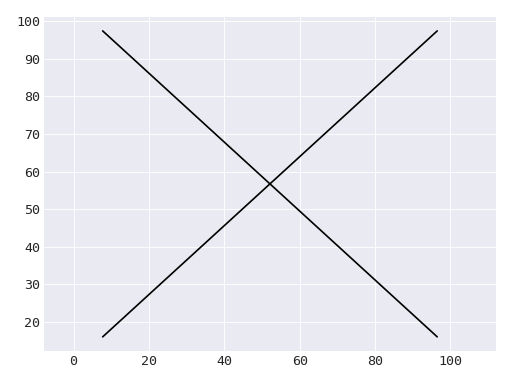
- class data_morph.shapes.lines.XLines(dataset: Dataset)[source]#
Bases:
LineCollectionClass for the X shape consisting of two crossing, perpendicular lines.

This shape is generated using the panda dataset.#
- Parameters:
dataset (Dataset) – The starting dataset to morph into other shapes.
- distance(x: Number, y: Number) float#
Calculate the minimum distance from the lines of this shape to a point (x, y).
- Parameters:
x (numbers.Number) – Coordinates of a point in 2D space.
y (numbers.Number) – Coordinates of a point in 2D space.
- Returns:
The minimum distance from the lines of this shape to the point (x, y).
- Return type:
Notes
Implementation based on this Stack Overflow answer.
- lines#
An iterable of two (x, y) pairs representing the endpoints of a line.
- Type:
Iterable[Iterable[numbers.Number]]
- name: str | None = 'x'#
The display name for the shape, if the lowercased class name is not desired.
- plot(ax: Axes | None = None) Axes#
Plot the shape.
- Parameters:
ax (matplotlib.axes.Axes, optional) – An optional
Axesobject to plot on.- Returns:
The
Axesobject containing the plot.- Return type:
Modules
Diamond shape. |
|
High lines shape. |
|
Horizontal lines shape. |
|
Rectangle shape. |
|
Slant down lines shape. |
|
Slant up lines shape. |
|
Star shape. |
|
Vertical lines shape. |
|
Wide lines shape. |
|
X lines shape. |