points#
Shapes made up of points.
- class data_morph.shapes.points.Club(dataset: Dataset)[source]#
Bases:
PointCollectionClass for the club shape.
This shape is generated using the panda dataset.#
- Parameters:
dataset (Dataset) – The starting dataset to morph into other shapes.
- distance(x: Number, y: Number) float#
Calculate the minimum distance from the points of this shape to a point (x, y).
- Parameters:
x (numbers.Number) – Coordinates of a point in 2D space.
y (numbers.Number) – Coordinates of a point in 2D space.
- Returns:
The minimum distance from the points of this shape to the point (x, y).
- Return type:
- name: str | None = None#
The display name for the shape, if the lowercased class name is not desired.
- plot(ax: Axes | None = None) Axes#
Plot the shape.
- Parameters:
ax (matplotlib.axes.Axes, optional) – An optional
Axesobject to plot on.- Returns:
The
Axesobject containing the plot.- Return type:
- points#
An array of (x, y) values representing an arrangement of points.
- Type:
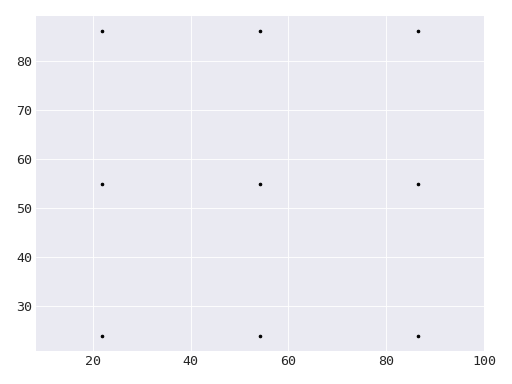
- class data_morph.shapes.points.DotsGrid(dataset: Dataset)[source]#
Bases:
PointCollectionClass representing a 3x3 grid of dots.
This shape is generated using the panda dataset.#
- Parameters:
dataset (Dataset) – The starting dataset to morph into other shapes.
- distance(x: Number, y: Number) float#
Calculate the minimum distance from the points of this shape to a point (x, y).
- Parameters:
x (numbers.Number) – Coordinates of a point in 2D space.
y (numbers.Number) – Coordinates of a point in 2D space.
- Returns:
The minimum distance from the points of this shape to the point (x, y).
- Return type:
- name: str | None = 'dots'#
The display name for the shape, if the lowercased class name is not desired.
- plot(ax: Axes | None = None) Axes#
Plot the shape.
- Parameters:
ax (matplotlib.axes.Axes, optional) – An optional
Axesobject to plot on.- Returns:
The
Axesobject containing the plot.- Return type:
- points#
An array of (x, y) values representing an arrangement of points.
- Type:
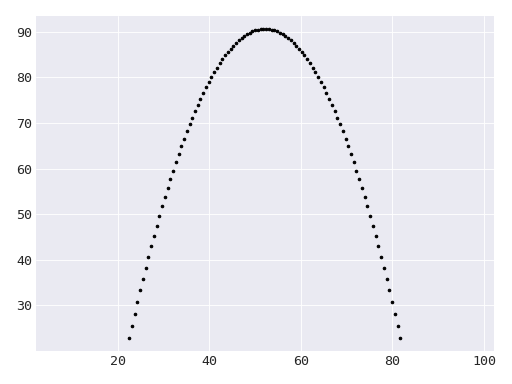
- class data_morph.shapes.points.DownParabola(dataset: Dataset)[source]#
Bases:
PointCollectionClass for the down parabola shape.
This shape is generated using the panda dataset.#
- Parameters:
dataset (Dataset) – The starting dataset to morph into other shapes.
- distance(x: Number, y: Number) float#
Calculate the minimum distance from the points of this shape to a point (x, y).
- Parameters:
x (numbers.Number) – Coordinates of a point in 2D space.
y (numbers.Number) – Coordinates of a point in 2D space.
- Returns:
The minimum distance from the points of this shape to the point (x, y).
- Return type:
- name: str | None = 'down_parab'#
The display name for the shape, if the lowercased class name is not desired.
- plot(ax: Axes | None = None) Axes#
Plot the shape.
- Parameters:
ax (matplotlib.axes.Axes, optional) – An optional
Axesobject to plot on.- Returns:
The
Axesobject containing the plot.- Return type:
- points#
An array of (x, y) values representing an arrangement of points.
- Type:
- class data_morph.shapes.points.FigureEight(dataset: Dataset)[source]#
Bases:
PointCollectionClass for the figure eight shape.
This shape is generated using the panda dataset.#
- Parameters:
dataset (Dataset) – The starting dataset to morph into other shapes. For datasets with larger y ranges than x ranges, the figure eight will be vertical; otherwise, it will be horizontal.
Notes
This shape uses the formula for the Lemniscate of Bernoulli. It will orient itself vertically or horizontally depending on which direction has a larger range in the input dataset. For example, the panda dataset used above resulted in a horizontal orientation, but the music dataset results in a vertical orientation:
This shape is generated using the music dataset.#
- distance(x: Number, y: Number) float#
Calculate the minimum distance from the points of this shape to a point (x, y).
- Parameters:
x (numbers.Number) – Coordinates of a point in 2D space.
y (numbers.Number) – Coordinates of a point in 2D space.
- Returns:
The minimum distance from the points of this shape to the point (x, y).
- Return type:
- name: str | None = 'figure_eight'#
The display name for the shape, if the lowercased class name is not desired.
- plot(ax: Axes | None = None) Axes#
Plot the shape.
- Parameters:
ax (matplotlib.axes.Axes, optional) – An optional
Axesobject to plot on.- Returns:
The
Axesobject containing the plot.- Return type:
- points#
An array of (x, y) values representing an arrangement of points.
- Type:
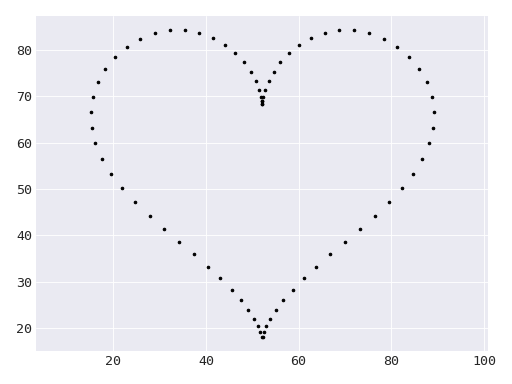
- class data_morph.shapes.points.Heart(dataset: Dataset)[source]#
Bases:
PointCollectionClass for the heart shape.
This shape is generated using the panda dataset.#
- Parameters:
dataset (Dataset) – The starting dataset to morph into other shapes.
Notes
The formula for the heart shape is inspired by Heart Curve:
Weisstein, Eric W. “Heart Curve.” From MathWorld –A Wolfram Web Resource. https://mathworld.wolfram.com/HeartCurve.html
- distance(x: Number, y: Number) float#
Calculate the minimum distance from the points of this shape to a point (x, y).
- Parameters:
x (numbers.Number) – Coordinates of a point in 2D space.
y (numbers.Number) – Coordinates of a point in 2D space.
- Returns:
The minimum distance from the points of this shape to the point (x, y).
- Return type:
- name: str | None = None#
The display name for the shape, if the lowercased class name is not desired.
- plot(ax: Axes | None = None) Axes#
Plot the shape.
- Parameters:
ax (matplotlib.axes.Axes, optional) – An optional
Axesobject to plot on.- Returns:
The
Axesobject containing the plot.- Return type:
- points#
An array of (x, y) values representing an arrangement of points.
- Type:
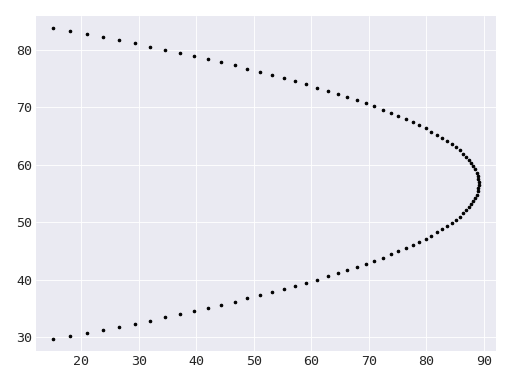
- class data_morph.shapes.points.LeftParabola(dataset: Dataset)[source]#
Bases:
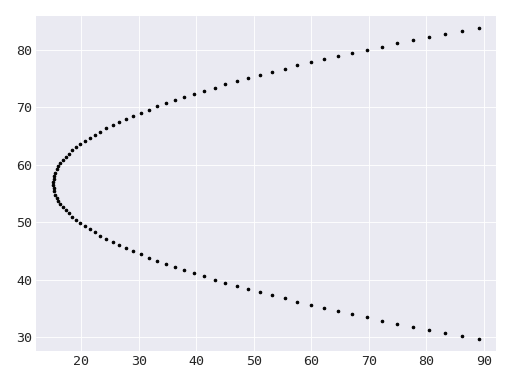
PointCollectionClass for the left parabola shape.

This shape is generated using the panda dataset.#
- Parameters:
dataset (Dataset) – The starting dataset to morph into other shapes.
- distance(x: Number, y: Number) float#
Calculate the minimum distance from the points of this shape to a point (x, y).
- Parameters:
x (numbers.Number) – Coordinates of a point in 2D space.
y (numbers.Number) – Coordinates of a point in 2D space.
- Returns:
The minimum distance from the points of this shape to the point (x, y).
- Return type:
- name: str | None = 'left_parab'#
The display name for the shape, if the lowercased class name is not desired.
- plot(ax: Axes | None = None) Axes#
Plot the shape.
- Parameters:
ax (matplotlib.axes.Axes, optional) – An optional
Axesobject to plot on.- Returns:
The
Axesobject containing the plot.- Return type:
- points#
An array of (x, y) values representing an arrangement of points.
- Type:
- class data_morph.shapes.points.RightParabola(dataset: Dataset)[source]#
Bases:
PointCollectionClass for the right parabola shape.
This shape is generated using the panda dataset.#
- Parameters:
dataset (Dataset) – The starting dataset to morph into other shapes.
- distance(x: Number, y: Number) float#
Calculate the minimum distance from the points of this shape to a point (x, y).
- Parameters:
x (numbers.Number) – Coordinates of a point in 2D space.
y (numbers.Number) – Coordinates of a point in 2D space.
- Returns:
The minimum distance from the points of this shape to the point (x, y).
- Return type:
- name: str | None = 'right_parab'#
The display name for the shape, if the lowercased class name is not desired.
- plot(ax: Axes | None = None) Axes#
Plot the shape.
- Parameters:
ax (matplotlib.axes.Axes, optional) – An optional
Axesobject to plot on.- Returns:
The
Axesobject containing the plot.- Return type:
- points#
An array of (x, y) values representing an arrangement of points.
- Type:
- class data_morph.shapes.points.Scatter(dataset: Dataset)[source]#
Bases:
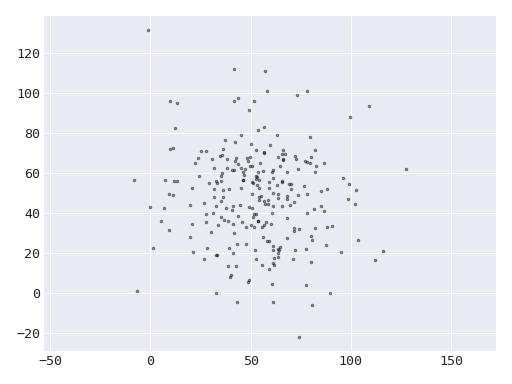
PointCollectionClass for the scatter shape: a cloud of randomly-scattered points.
This shape is generated using the panda dataset.#
- Parameters:
dataset (Dataset) – The starting dataset to morph into other shapes.
- distance(x: Number, y: Number) int[source]#
No-op that allows returns 0 so that all perturbations are accepted.
- name: str | None = None#
The display name for the shape, if the lowercased class name is not desired.
- plot(ax: Axes | None = None) Axes#
Plot the shape.
- Parameters:
ax (matplotlib.axes.Axes, optional) – An optional
Axesobject to plot on.- Returns:
The
Axesobject containing the plot.- Return type:
- points#
An array of (x, y) values representing an arrangement of points.
- Type:
- class data_morph.shapes.points.Spade(dataset: Dataset)[source]#
Bases:
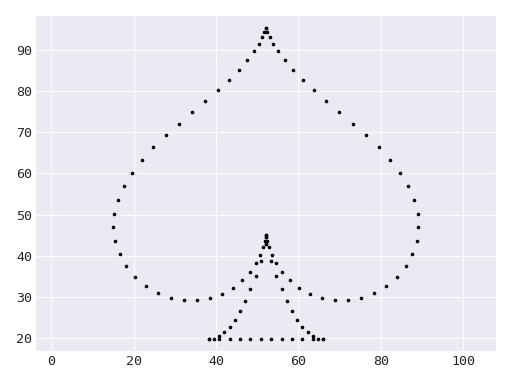
PointCollectionClass for the spade shape.
This shape is generated using the panda dataset.#
- Parameters:
dataset (Dataset) – The starting dataset to morph into other shapes.
- distance(x: Number, y: Number) float#
Calculate the minimum distance from the points of this shape to a point (x, y).
- Parameters:
x (numbers.Number) – Coordinates of a point in 2D space.
y (numbers.Number) – Coordinates of a point in 2D space.
- Returns:
The minimum distance from the points of this shape to the point (x, y).
- Return type:
- name: str | None = None#
The display name for the shape, if the lowercased class name is not desired.
- plot(ax: Axes | None = None) Axes#
Plot the shape.
- Parameters:
ax (matplotlib.axes.Axes, optional) – An optional
Axesobject to plot on.- Returns:
The
Axesobject containing the plot.- Return type:
- points#
An array of (x, y) values representing an arrangement of points.
- Type:
- class data_morph.shapes.points.Spiral(dataset: Dataset)[source]#
Bases:
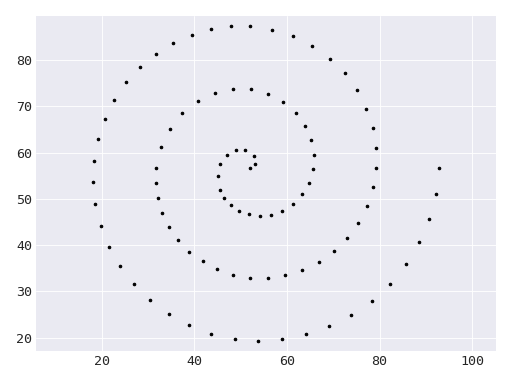
PointCollectionClass for the spiral shape.

This shape is generated using the panda dataset.#
- Parameters:
dataset (Dataset) – The starting dataset to morph into other shapes.
Notes
This shape uses the formula for an Archimedean spiral.
- distance(x: Number, y: Number) float#
Calculate the minimum distance from the points of this shape to a point (x, y).
- Parameters:
x (numbers.Number) – Coordinates of a point in 2D space.
y (numbers.Number) – Coordinates of a point in 2D space.
- Returns:
The minimum distance from the points of this shape to the point (x, y).
- Return type:
- name: str | None = None#
The display name for the shape, if the lowercased class name is not desired.
- plot(ax: Axes | None = None) Axes#
Plot the shape.
- Parameters:
ax (matplotlib.axes.Axes, optional) – An optional
Axesobject to plot on.- Returns:
The
Axesobject containing the plot.- Return type:
- points#
An array of (x, y) values representing an arrangement of points.
- Type:
- class data_morph.shapes.points.UpParabola(dataset: Dataset)[source]#
Bases:
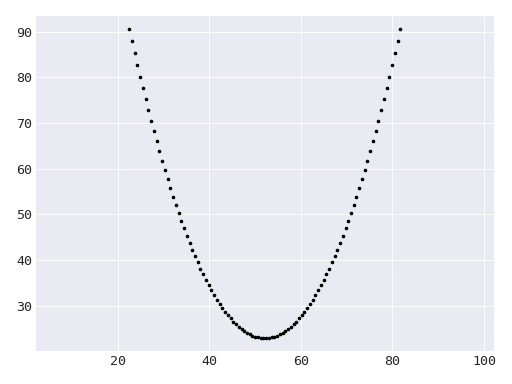
PointCollectionClass for the up parabola shape.
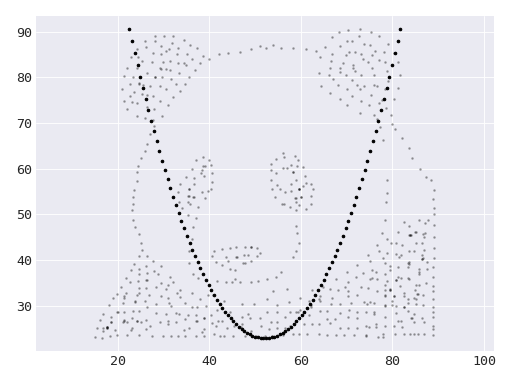
This shape is generated using the panda dataset.#
- Parameters:
dataset (Dataset) – The starting dataset to morph into other shapes.
- distance(x: Number, y: Number) float#
Calculate the minimum distance from the points of this shape to a point (x, y).
- Parameters:
x (numbers.Number) – Coordinates of a point in 2D space.
y (numbers.Number) – Coordinates of a point in 2D space.
- Returns:
The minimum distance from the points of this shape to the point (x, y).
- Return type:
- name: str | None = 'up_parab'#
The display name for the shape, if the lowercased class name is not desired.
- plot(ax: Axes | None = None) Axes#
Plot the shape.
- Parameters:
ax (matplotlib.axes.Axes, optional) – An optional
Axesobject to plot on.- Returns:
The
Axesobject containing the plot.- Return type:
- points#
An array of (x, y) values representing an arrangement of points.
- Type:
Modules