Custom Datasets#
This tutorial provides guidance on how to move from an idea for a custom dataset to an input dataset for morphing.
Generate points#
Below are some ways to create an original starter dataset. Each method will
yield some (x, y) points, which may be in web browser coordinates or Cartesian
coordinates. Save these to a text file called points.txt for processing in the
next step.
Note
All tools included in this section are for reference only; this is not an endorsement.
Drawing a shape#
If you have a shape in mind or plan to trace one, you can use a tool like the following to create (x, y) points by free-hand drawing or tracing an image:
Trace an image with Mobilefish.com (web browser coordinates)
Draw an image with DrawMyData (Cartesian coordinates)
Using an SVG image#
If you are starting from an SVG image, you can use a tool like PathToPoints to generate points (in web browser coordinates) from the paths in the SVG file. Depending on the starting image, you may want to crop and/or remove whitespace from the SVG file before generating the points. Note that the linked tools are just examples; make sure to look for the tool that works for your use case.
Create a CSV file in Cartesian coordinates#
Depending on the tool you use to generate your points in the previous step, your points may be in the web browser coordinate system, in which case they will appear upside-down unless we flip them. Use the following code to convert the points into Cartesian coordinates (if necessary), save to a CSV file for morphing, and plot it:
import pandas as pd
import matplotlib.pyplot as plt


# whether the points are in web browser coordinates
browser_coordinates = True

with open('points.txt') as file:
    points = pd.DataFrame(
        [tuple(map(float, line.split(','))) for line in file.readlines()],
        columns=['x', 'y'],
    )

    if browser_coordinates:
        # reflect points over the x-axis (web browser coordinates only)
        points = points.assign(y=lambda df: -df.y)

    points.to_csv('points.csv', index=False)

points.plot(kind='scatter', x='x', y='y', color='black', s=1).axis('equal')
plt.show()
Note
While Data Morph provides a scaling option, consider scaling the data when creating your CSV file to save some typing later. For example, you can divide all values by 10 to scale down by a factor of 10. This makes morphing faster.
Likewise, you can shift the data in the x/y direction at this step, although this is purely aesthetic.
Morph the data#
Pass the path to the CSV file to use those points as the starting shape:
$ data-morph --start path/to/points.csv --target wide_lines --classic
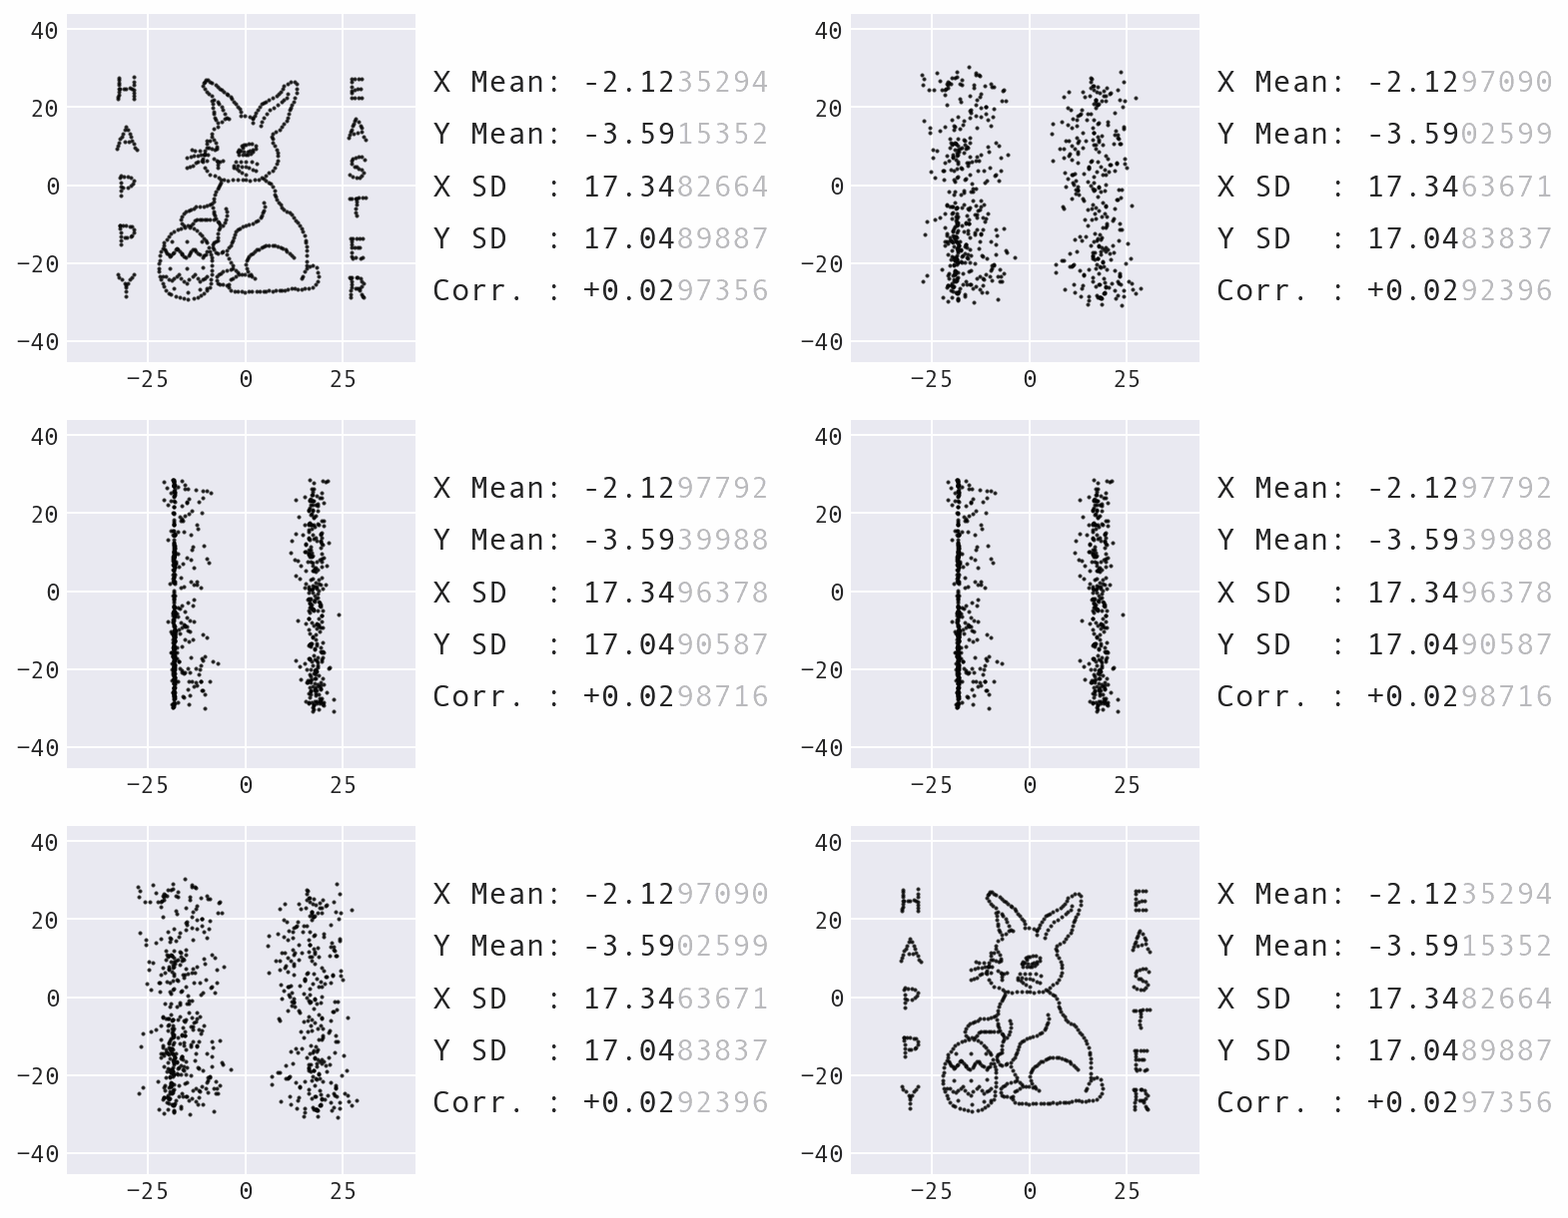
Here is an example animation generated from a custom dataset:

Congratulations, you’ve found the Easter egg!#
(Optional) Contribute the dataset#
If you have the rights to distribute the dataset and you think it would be a good built-in dataset, create an issue in the Data Morph repository proposing its inclusion. Be sure to consult the contributing guidelines before doing so.
If and only if you are given the go ahead:
Add your CSV file to the
src/data_morph/data/starter_shapes/directory.Add an entry to the
DataLoader._DATASETSdictionary insrc/data_morph/data/loader.py.Submit your pull request.
Note
For inclusion in Data Morph, the proposed dataset must work with more
than one shape. You can pass all as the target shape to generate all
options for inspection:
$ data-morph --start path/to/points.csv --target all
